AWS X-Ray is a distributed tracing service provided by Amazon Web Services (AWS) that helps developers analyze and debug applications that are composed of multiple microservices. It provides insights into how an application is performing and where issues might be occurring, allowing developers to optimize performance and troubleshoot errors effectively.
Here’s a comprehensive explanation of AWS X-Ray:
Distributed Tracing: X-Ray enables you to trace requests as they travel through your application stack. It provides a detailed view of how requests propagate through your application, across different AWS services and components.
Instrumentation: To use X-Ray, you instrument your application code by adding X-Ray SDKs to your application. These SDKs capture metadata about incoming requests, including details such as timing, errors, and downstream service calls.
Trace Segments: As requests flow through your application, X-Ray captures data about each component they interact with. These data points are called “trace segments.” Each segment contains information about a specific component or action within your application.
Trace Graph: X-Ray aggregates trace segments into a visual representation called a “trace graph.” This graph shows the path of a request through your application, including any upstream and downstream dependencies.
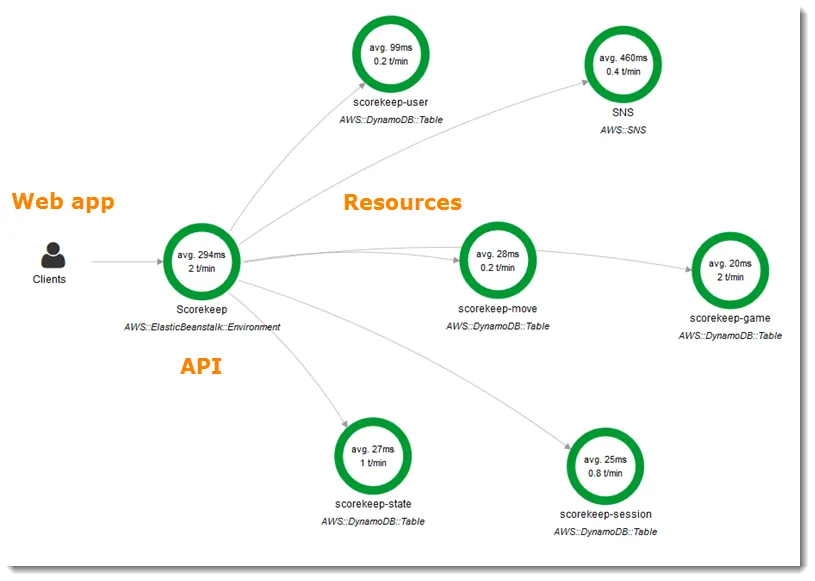
Service Map: X-Ray can generate a service map, which provides an overview of all the components and services in your application, along with their relationships. This map helps you understand how different parts of your application interact with each other.
Performance Monitoring: With X-Ray, you can monitor the performance of your application in real-time. You can identify bottlenecks, latency issues, and areas for optimization by analyzing trace data and metrics.
Fault Analysis: X-Ray helps you debug errors and faults in your application by providing detailed information about where errors occur and what caused them. You can quickly pinpoint the root cause of issues and take corrective actions.
Integration with AWS Services: X-Ray seamlessly integrates with various AWS services, including AWS Lambda, Amazon EC2, Amazon ECS, and Amazon API Gateway. This allows you to trace requests across different AWS resources and gain insights into their performance and behavior.
Integration with Third-Party Services: X-Ray supports integration with third-party services through the use of plugins and custom instrumentation. This enables you to trace requests across your entire application stack, even if it spans multiple cloud providers or on-premises environments.
Security and Compliance: X-Ray provides features to help you meet security and compliance requirements. You can control access to trace data using AWS Identity and Access Management (IAM) policies, and you can encrypt trace data using AWS Key Management Service (KMS).
Overall, AWS X-Ray is a powerful tool for monitoring, troubleshooting, and optimizing distributed applications. It gives developers deep insights into their application’s behavior, helping them deliver better-performing and more reliable software
AWS X-Ray is a distributed tracing service provided by Amazon Web Services (AWS) that helps developers analyze and debug applications that are composed of multiple microservices. It provides insights into how an application is performing and where issues might be occurring, allowing developers to optimize performance and troubleshoot errors effectively.
Here’s a comprehensive explanation of AWS X-Ray:
Distributed Tracing: X-Ray enables you to trace requests as they travel through your application stack. It provides a detailed view of how requests propagate through your application, across different AWS services and components.
Instrumentation: To use X-Ray, you instrument your application code by adding X-Ray SDKs to your application. These SDKs capture metadata about incoming requests, including details such as timing, errors, and downstream service calls.
Trace Segments: As requests flow through your application, X-Ray captures data about each component they interact with. These data points are called “trace segments.” Each segment contains information about a specific component or action within your application.
Trace Graph: X-Ray aggregates trace segments into a visual representation called a “trace graph.” This graph shows the path of a request through your application, including any upstream and downstream dependencies.
Service Map: X-Ray can generate a service map, which provides an overview of all the components and services in your application, along with their relationships. This map helps you understand how different parts of your application interact with each other.
Performance Monitoring: With X-Ray, you can monitor the performance of your application in real-time. You can identify bottlenecks, latency issues, and areas for optimization by analyzing trace data and metrics.
Fault Analysis: X-Ray helps you debug errors and faults in your application by providing detailed information about where errors occur and what caused them. You can quickly pinpoint the root cause of issues and take corrective actions.
Integration with AWS Services: X-Ray seamlessly integrates with various AWS services, including AWS Lambda, Amazon EC2, Amazon ECS, and Amazon API Gateway. This allows you to trace requests across different AWS resources and gain insights into their performance and behavior.
Integration with Third-Party Services: X-Ray supports integration with third-party services through the use of plugins and custom instrumentation. This enables you to trace requests across your entire application stack, even if it spans multiple cloud providers or on-premises environments.
Security and Compliance: X-Ray provides features to help you meet security and compliance requirements. You can control access to trace data using AWS Identity and Access Management (IAM) policies, and you can encrypt trace data using AWS Key Management Service (KMS).
Overall, AWS X-Ray is a powerful tool for monitoring, troubleshooting, and optimizing distributed applications. It gives developers deep insights into their application’s behavior, helping them deliver better-performing and more reliable software