Introduction:
Data is ubiquitous in our modern world, driving decision-making, innovation, and discovery across diverse domains. However, to truly understand and derive insights from data, it must be effectively represented and analyzed. In this blog post, we’ll explore two powerful methods of representing data: graphical and analytical techniques.
Graphical Representation of Data:
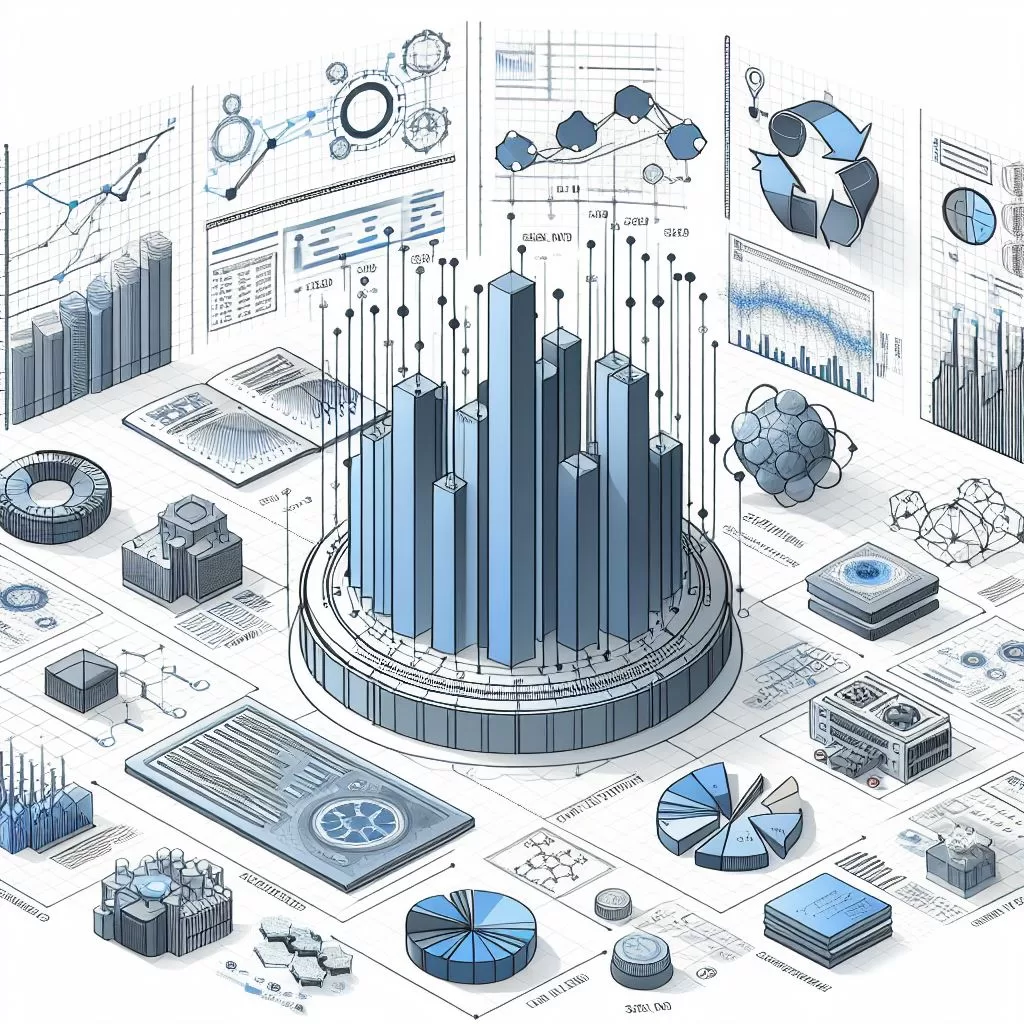
Graphical representation involves visually depicting data using charts, graphs, and diagrams. This approach offers a intuitive and accessible way to convey information, patterns, and trends within the data. Some common graphical representations include:
Bar Charts: Used to compare categorical data by showing the frequency or proportion of each category using bars of varying heights.
Histograms: Display the distribution of numerical data by dividing it into intervals (bins) and plotting the frequency or density of observations within each interval.
Line Graphs: Show the relationship between two variables over time or continuous intervals by connecting data points with lines.
Scatter Plots: Illustrate the relationship between two continuous variables by plotting individual data points on a Cartesian coordinate system.
Pie Charts: Represent categorical data as slices of a circle, with each slice corresponding to a proportion of the whole.
Graphical representations offer several advantages, including ease of interpretation, visualization of trends, and the ability to identify outliers or patterns that may not be apparent in raw data.
Analytical Representation of Data:
Analytical representation involves summarizing and analyzing data using statistical techniques, mathematical models, and computational algorithms. This approach aims to uncover underlying patterns, relationships, and insights within the data. Some common analytical techniques include:
Descriptive Statistics: Summarize the central tendency, dispersion, and shape of data distributions using measures such as mean, median, mode, standard deviation, and range.
Inferential Statistics: Make inferences or predictions about a population based on a sample of data, using techniques such as hypothesis testing, confidence intervals, and regression analysis.
Machine Learning Algorithms: Learn patterns and relationships within data to make predictions, classify data into categories, or cluster similar observations together. Common machine learning algorithms include linear regression, decision trees, support vector machines, and neural networks.
Data Mining: Explore large datasets to discover hidden patterns, associations, or trends using techniques such as clustering, association rule mining, and anomaly detection.
Analytical representation provides a deeper understanding of data by quantitatively analyzing its characteristics, relationships, and significance. It allows for rigorous testing of hypotheses, validation of assumptions, and exploration of complex interactions within the data.
Integration of Graphical and Analytical Representation:
While graphical and analytical representation offer distinct approaches to understanding data, they are often complementary and can be used in conjunction to provide a comprehensive analysis. By combining visualizations with statistical analysis, researchers, analysts, and decision-makers can gain a more holistic view of the data, uncovering insights that may not be apparent through either approach alone.
Conclusion:
In conclusion, graphical and analytical representation are powerful tools for exploring and understanding data. Whether you’re visualizing trends in a sales dataset, analyzing the effectiveness of a marketing campaign, or predicting customer behavior, these techniques provide invaluable insights that drive informed decision-making and innovation. By leveraging both graphical and analytical approaches, we can unlock the full potential of data to solve complex problems and drive positive change in our world.


